Spring Cloud Microservices Beginner Tutorial (1): Microservices Introduction Spring Cloud Microservices Beginner Tutorial (2): Service Registration and Discovery — Eureka Spring Cloud Microservices Beginner Tutorial (3): Service Registration Spring Cloud Microservices Beginner Tutorial (4): Inter-service Invocation — FeignClient Spring Cloud Microservices Beginner Tutorial (5): Centralized Config — ConfigService Spring Cloud Microservices Beginner Tutorial (6): Spring Cloud BUS Message Bus for Dynamic Config Refresh Spring Cloud Microservices Beginner Tutorial (7): Spring Cloud Stream Message-driven Microservices Spring Cloud Microservices Beginner Tutorial (8): Spring Cloud Zuul API Gateway Dynamic Routing, Cookie Passing, and CORS Spring Cloud Microservices Beginner Tutorial (9): Zuul Gateway Integrating Swagger2 for Auto-generated RESTful API Docs Spring Cloud Microservices Beginner Tutorial (10): Spring Cloud Hystrix Circuit Breaking and Service Degradation Spring Cloud Microservices Beginner Tutorial (11): Spring Cloud Sleuth + Zipkin Service Tracing and Link Monitoring Spring Cloud Microservices Beginner Tutorial (12): Spring Cloud Docker Containerized Deployment
Code will be shared at https://github.com/NeilRen/SpringCloudDemo, with different branches for different chapters; the Master branch contains the final combined content. This chapter’s code is at: https://github.com/NeilRen/SpringCloudDemo/tree/feature/spring-cloud-sleuth
Original This article is original, author: Ren Fei. Please cite the author and source when reposting.
In the previous section we covered circuit breaking and degradation, and we can basically build a fairly complete microservices architecture now. But a microservices architecture is distributed — each service runs independently while depending on others — so if a problem occurs, it’s hard to trace where it is. We need a service-tracing solution, and Spring Cloud Sleuth provides service tracing and link monitoring.
Google open-sourced the Dapper tracing component and published the paper “Dapper, a Large-Scale Distributed Systems Tracing Infrastructure” in 2010; this paper is the benchmark and theoretical foundation for link tracing in the industry and is highly valuable as a reference. Currently, link tracing includes Google’s Dapper, Twitter’s Zipkin, and Alibaba’s EagleEye, among others. This section mainly explains integrating Zipkin in Spring Cloud Sleuth. Integrating Zipkin in Spring Cloud Sleuth is very simple — you just need to add the relevant dependency and configuration.
Prepare the Required Environment
Before starting, you need to prepare the environment. I run Zipkin in Docker. Since the topic is microservices, I won’t repeat Docker installation; here is the Docker install/image command directly:
docker run -d -p 9411:9411 openzipkin/zipkinAdd the Dependency
We use democlient as the demonstration case. Modify the POM file and add the spring-cloud-starter-zipkin dependency. It actually also depends on spring-cloud-starter-sleuth and spring-cloud-starter-zipkin, so we don’t need to write those two dependencies — just spring-cloud-starter-zipkin. The POM is as follows:
<?xml version="1.0" encoding="UTF-8"?>
<project xmlns="http://maven.apache.org/POM/4.0.0"
         xmlns:xsi="http://www.w3.org/2001/XMLSchema-instance"
         xsi:schemaLocation="http://maven.apache.org/POM/4.0.0 http://maven.apache.org/xsd/maven-4.0.0.xsd">
    <parent>
        <artifactId>cloud</artifactId>
        <groupId>net.renfei</groupId>
        <version>1.0.0</version>
    </parent>
    <modelVersion>4.0.0</modelVersion>
    <groupId>net.renfei</groupId>
    <artifactId>democlient</artifactId>
    <version>1.0.0</version>
    <name>demo-client</name>
    <description>Demo service</description>
    <dependencies>
        <dependency>
            <groupId>org.springframework.boot</groupId>
            <artifactId>spring-boot-starter-web</artifactId>
        </dependency>
        <dependency>
            <groupId>net.renfei</groupId>
            <artifactId>apicenter</artifactId>
            <version>1.0.0</version>
        </dependency>
        <dependency>
            <groupId>org.springframework.cloud</groupId>
            <artifactId>spring-cloud-starter-openfeign</artifactId>
        </dependency>
        <dependency>
            <groupId>org.springframework.cloud</groupId>
            <artifactId>spring-cloud-config-client</artifactId>
        </dependency>
        <dependency>
            <groupId>org.springframework.cloud</groupId>
            <artifactId>spring-cloud-starter-bus-amqp</artifactId>
        </dependency>
        <dependency>
            <groupId>org.springframework.cloud</groupId>
            <artifactId>spring-cloud-starter-stream-rabbit</artifactId>
        </dependency>
        <dependency>
            <groupId>org.springframework.cloud</groupId>
            <artifactId>spring-cloud-starter-zipkin</artifactId>
        </dependency>
    </dependencies>
    <build>
        <plugins>
            <plugin>
                <groupId>org.springframework.boot</groupId>
                <artifactId>spring-boot-maven-plugin</artifactId>
            </plugin>
        </plugins>
    </build>
</project>
Then modify the configuration file. For convenience of demonstration, I directly modify the bootstrap.yml configuration file:
spring:
  zipkin:
    base-url: http://localhost:9411/
  sleuth:
    sampler:
      rate: 100
Here we configure spring.zipkin.base-url, which is the access address of our Zipkin; spring.sleuth.sampler.rate configures the per-second rate limit. Without a limit, when business volume is very large our network and monitoring services may face huge pressure, so we configure a limit on how many reports per second — enough to find the cause.
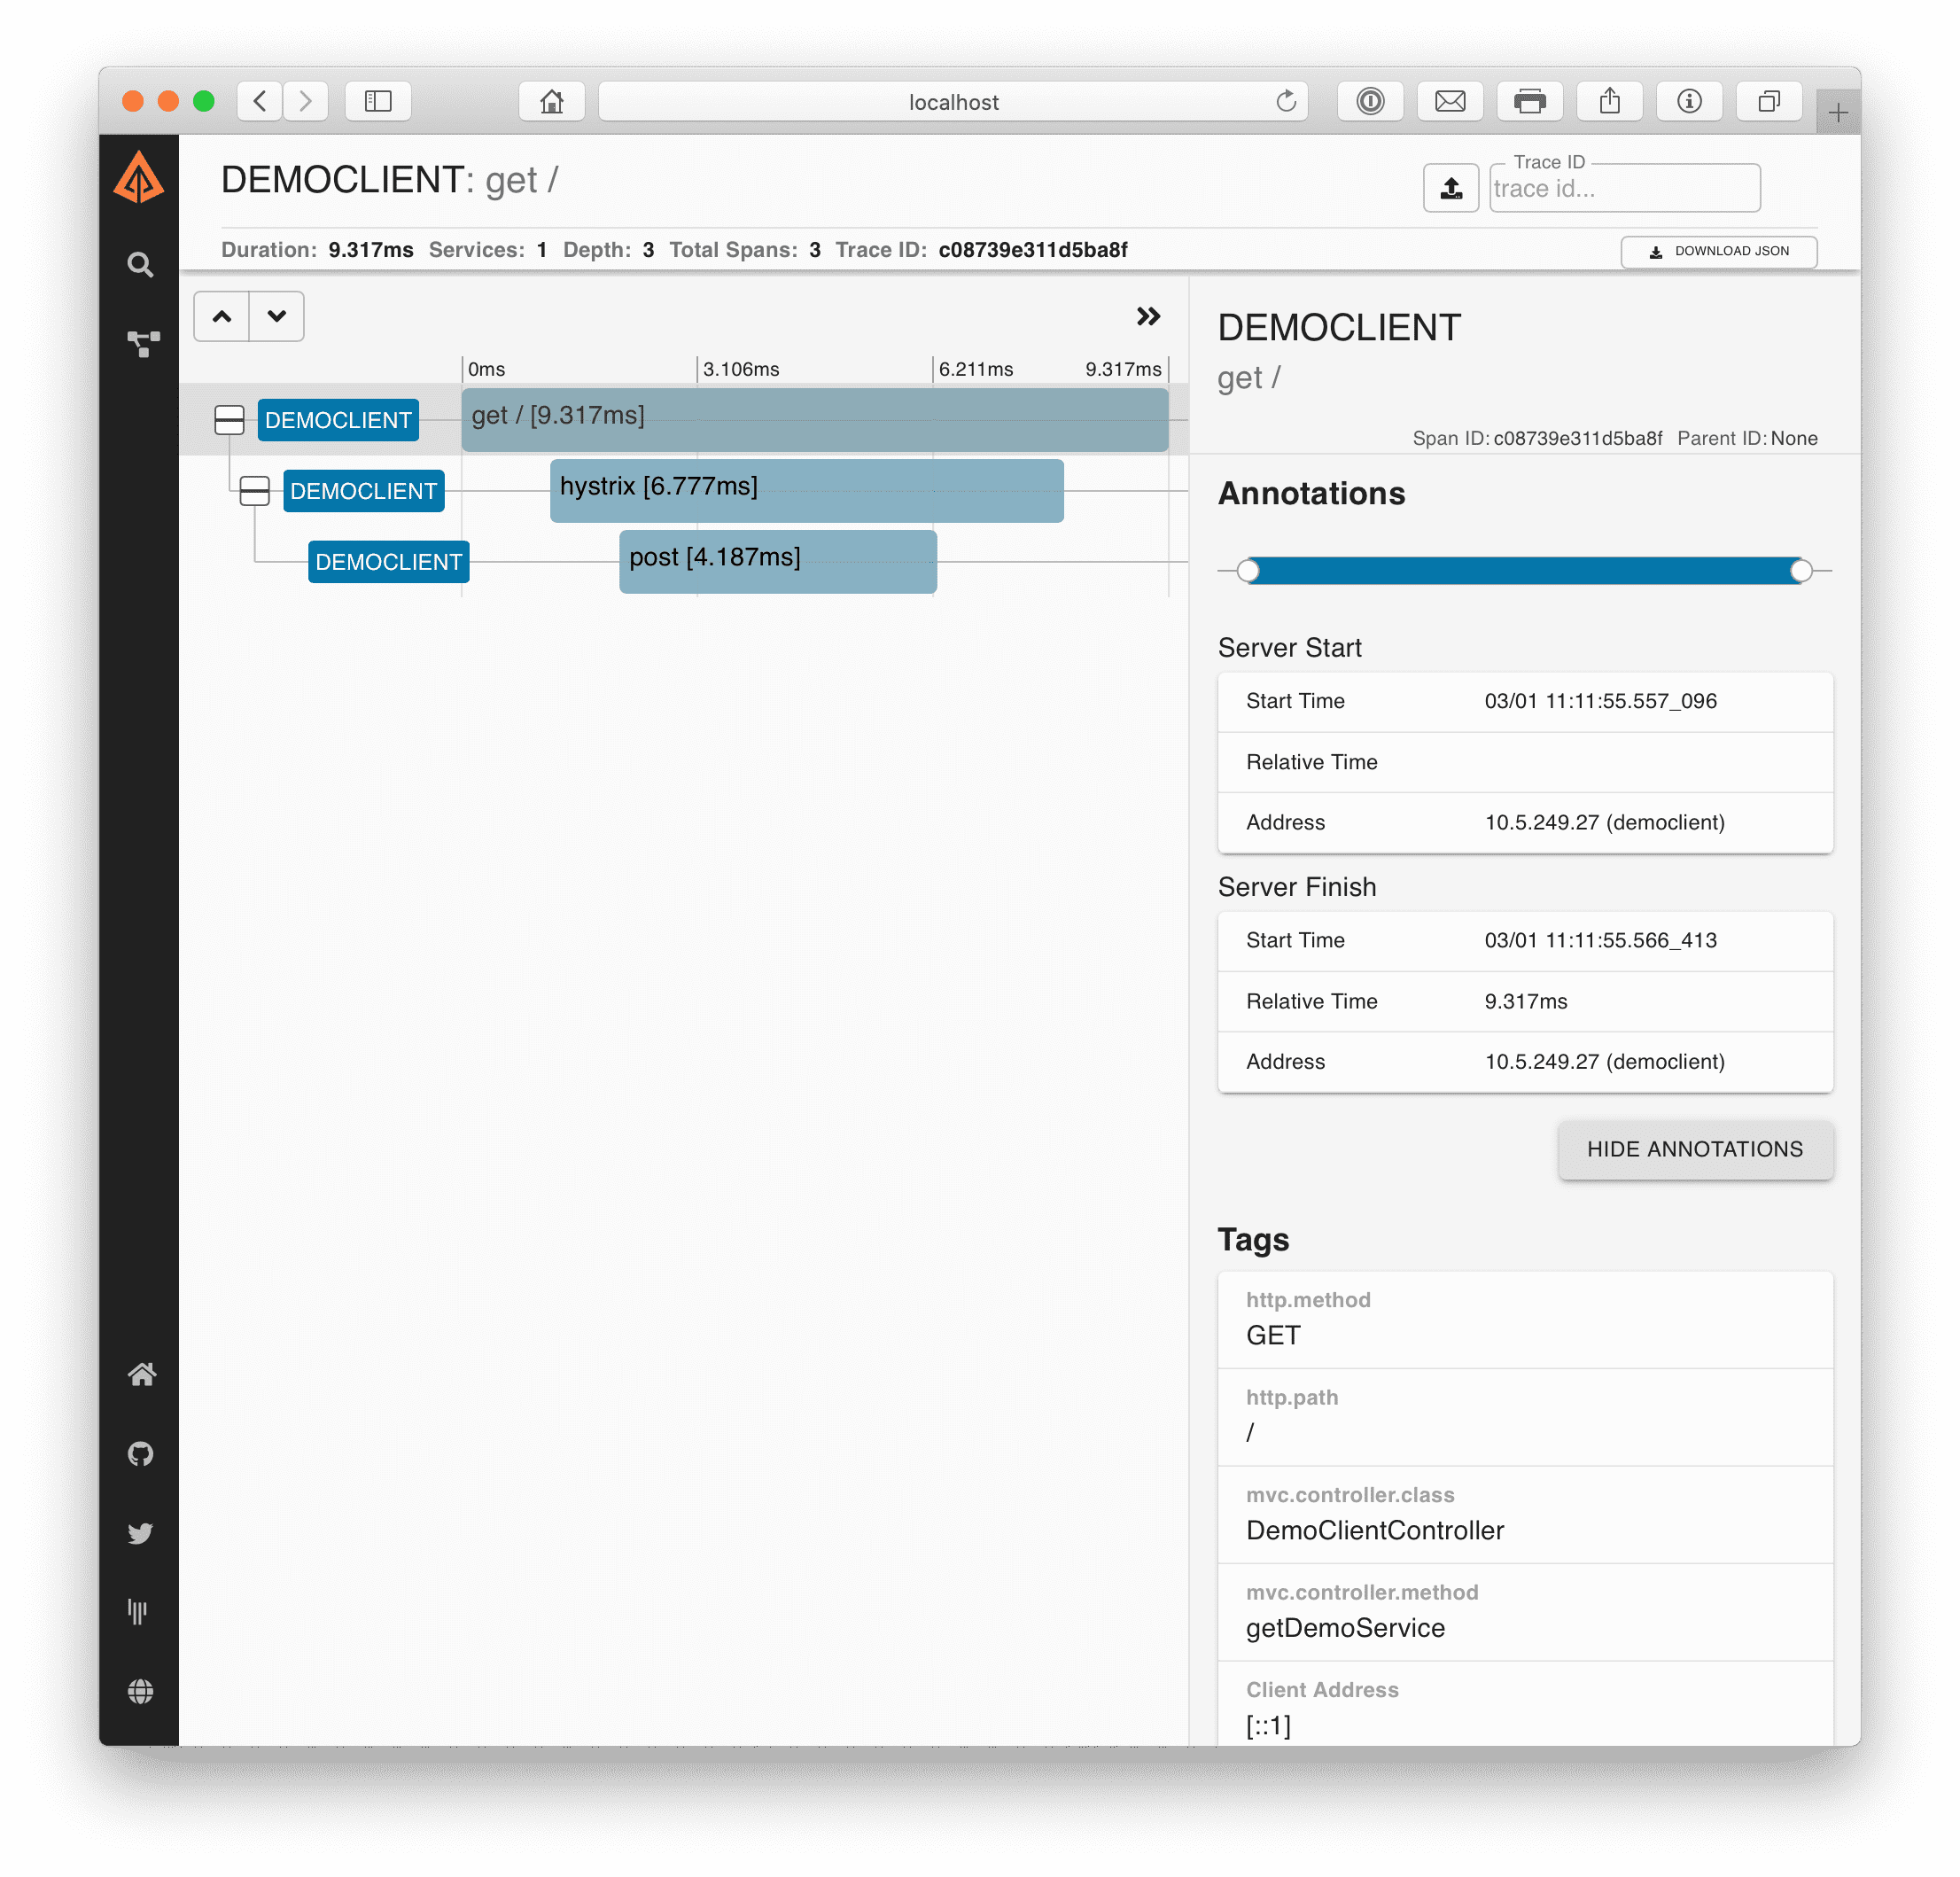
Then we start the registry, config center, each service module, and the API gateway in turn, then access the service provided by democlient, and go to Zipkin to see the link and content of this request, as shown in the figure:
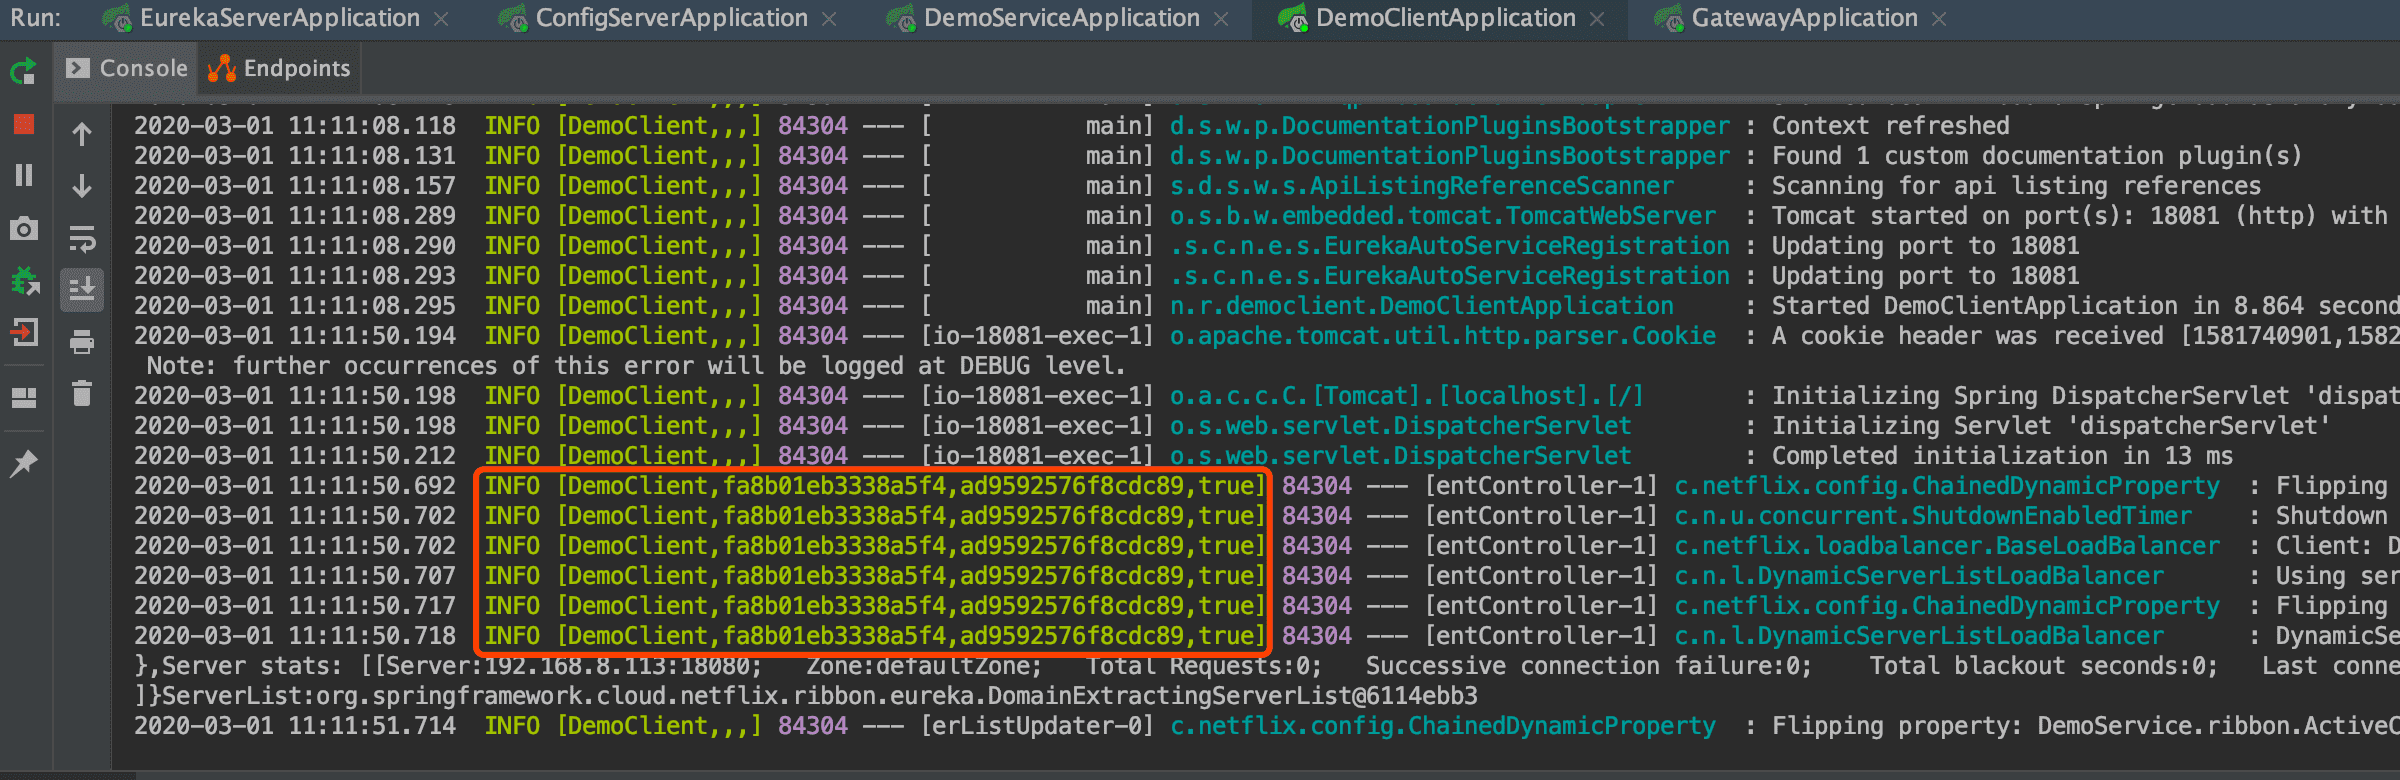
In the console we also see the link ID; the final true means it is sent externally to Zipkin, as shown in the figure: