

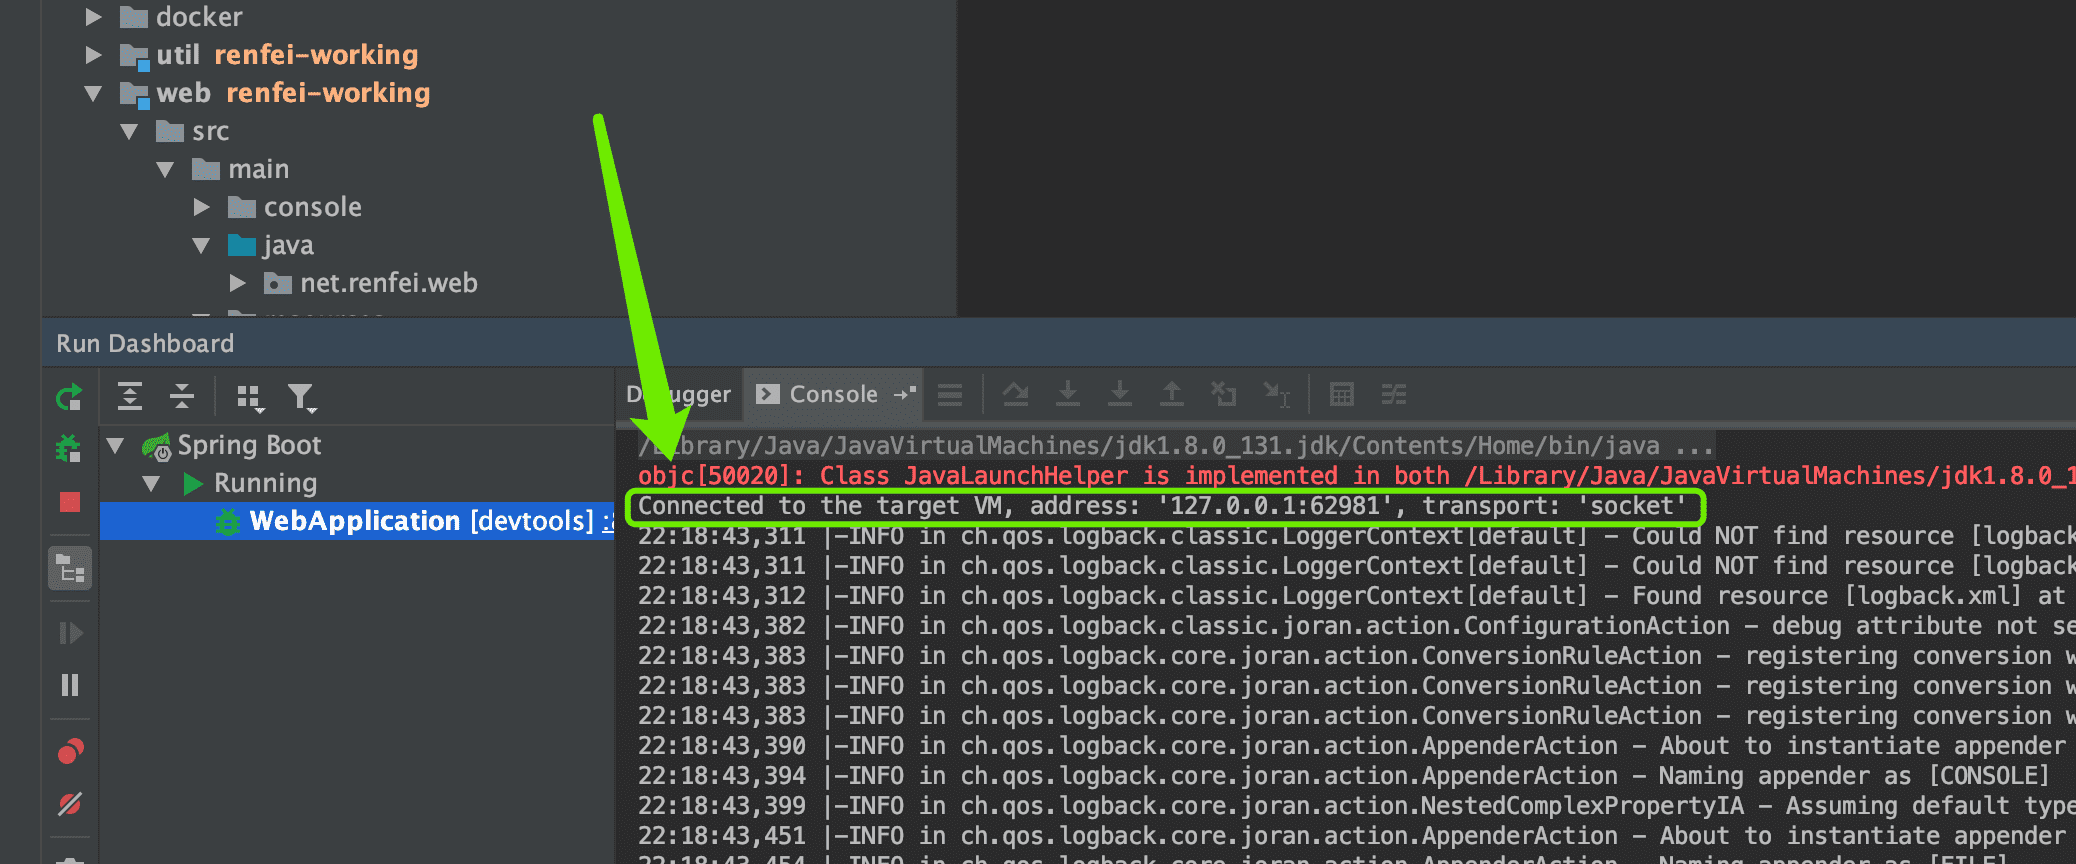
When we use IDEA to DEBUG code, the console often prints something like: “Connected to the target VM, address: ‘127.0.0.1:62981’, transport: ‘socket’”. So even if the code doesn’t run locally, as long as the JVM has debug mode on and the network can connect to the JVM via socket, the Debug protocol over Socket communication can pass debug commands and debug info.
Configure the IDEA Launch Environment (Remote Debug Server)
Open IntelliJ IDEA, choose “Edit Configurations” at the top right, then click the + sign at the top left and select “Remote”. As shown below, fill in Name (any name), host is the IP/hostname of the machine whose code you want to debug remotely, port is the debug listening port — if the remote server already has the remote debug port open, fill that; if not, pick the default 5005. Use Module classpath selects which module the remotely running code belongs to.
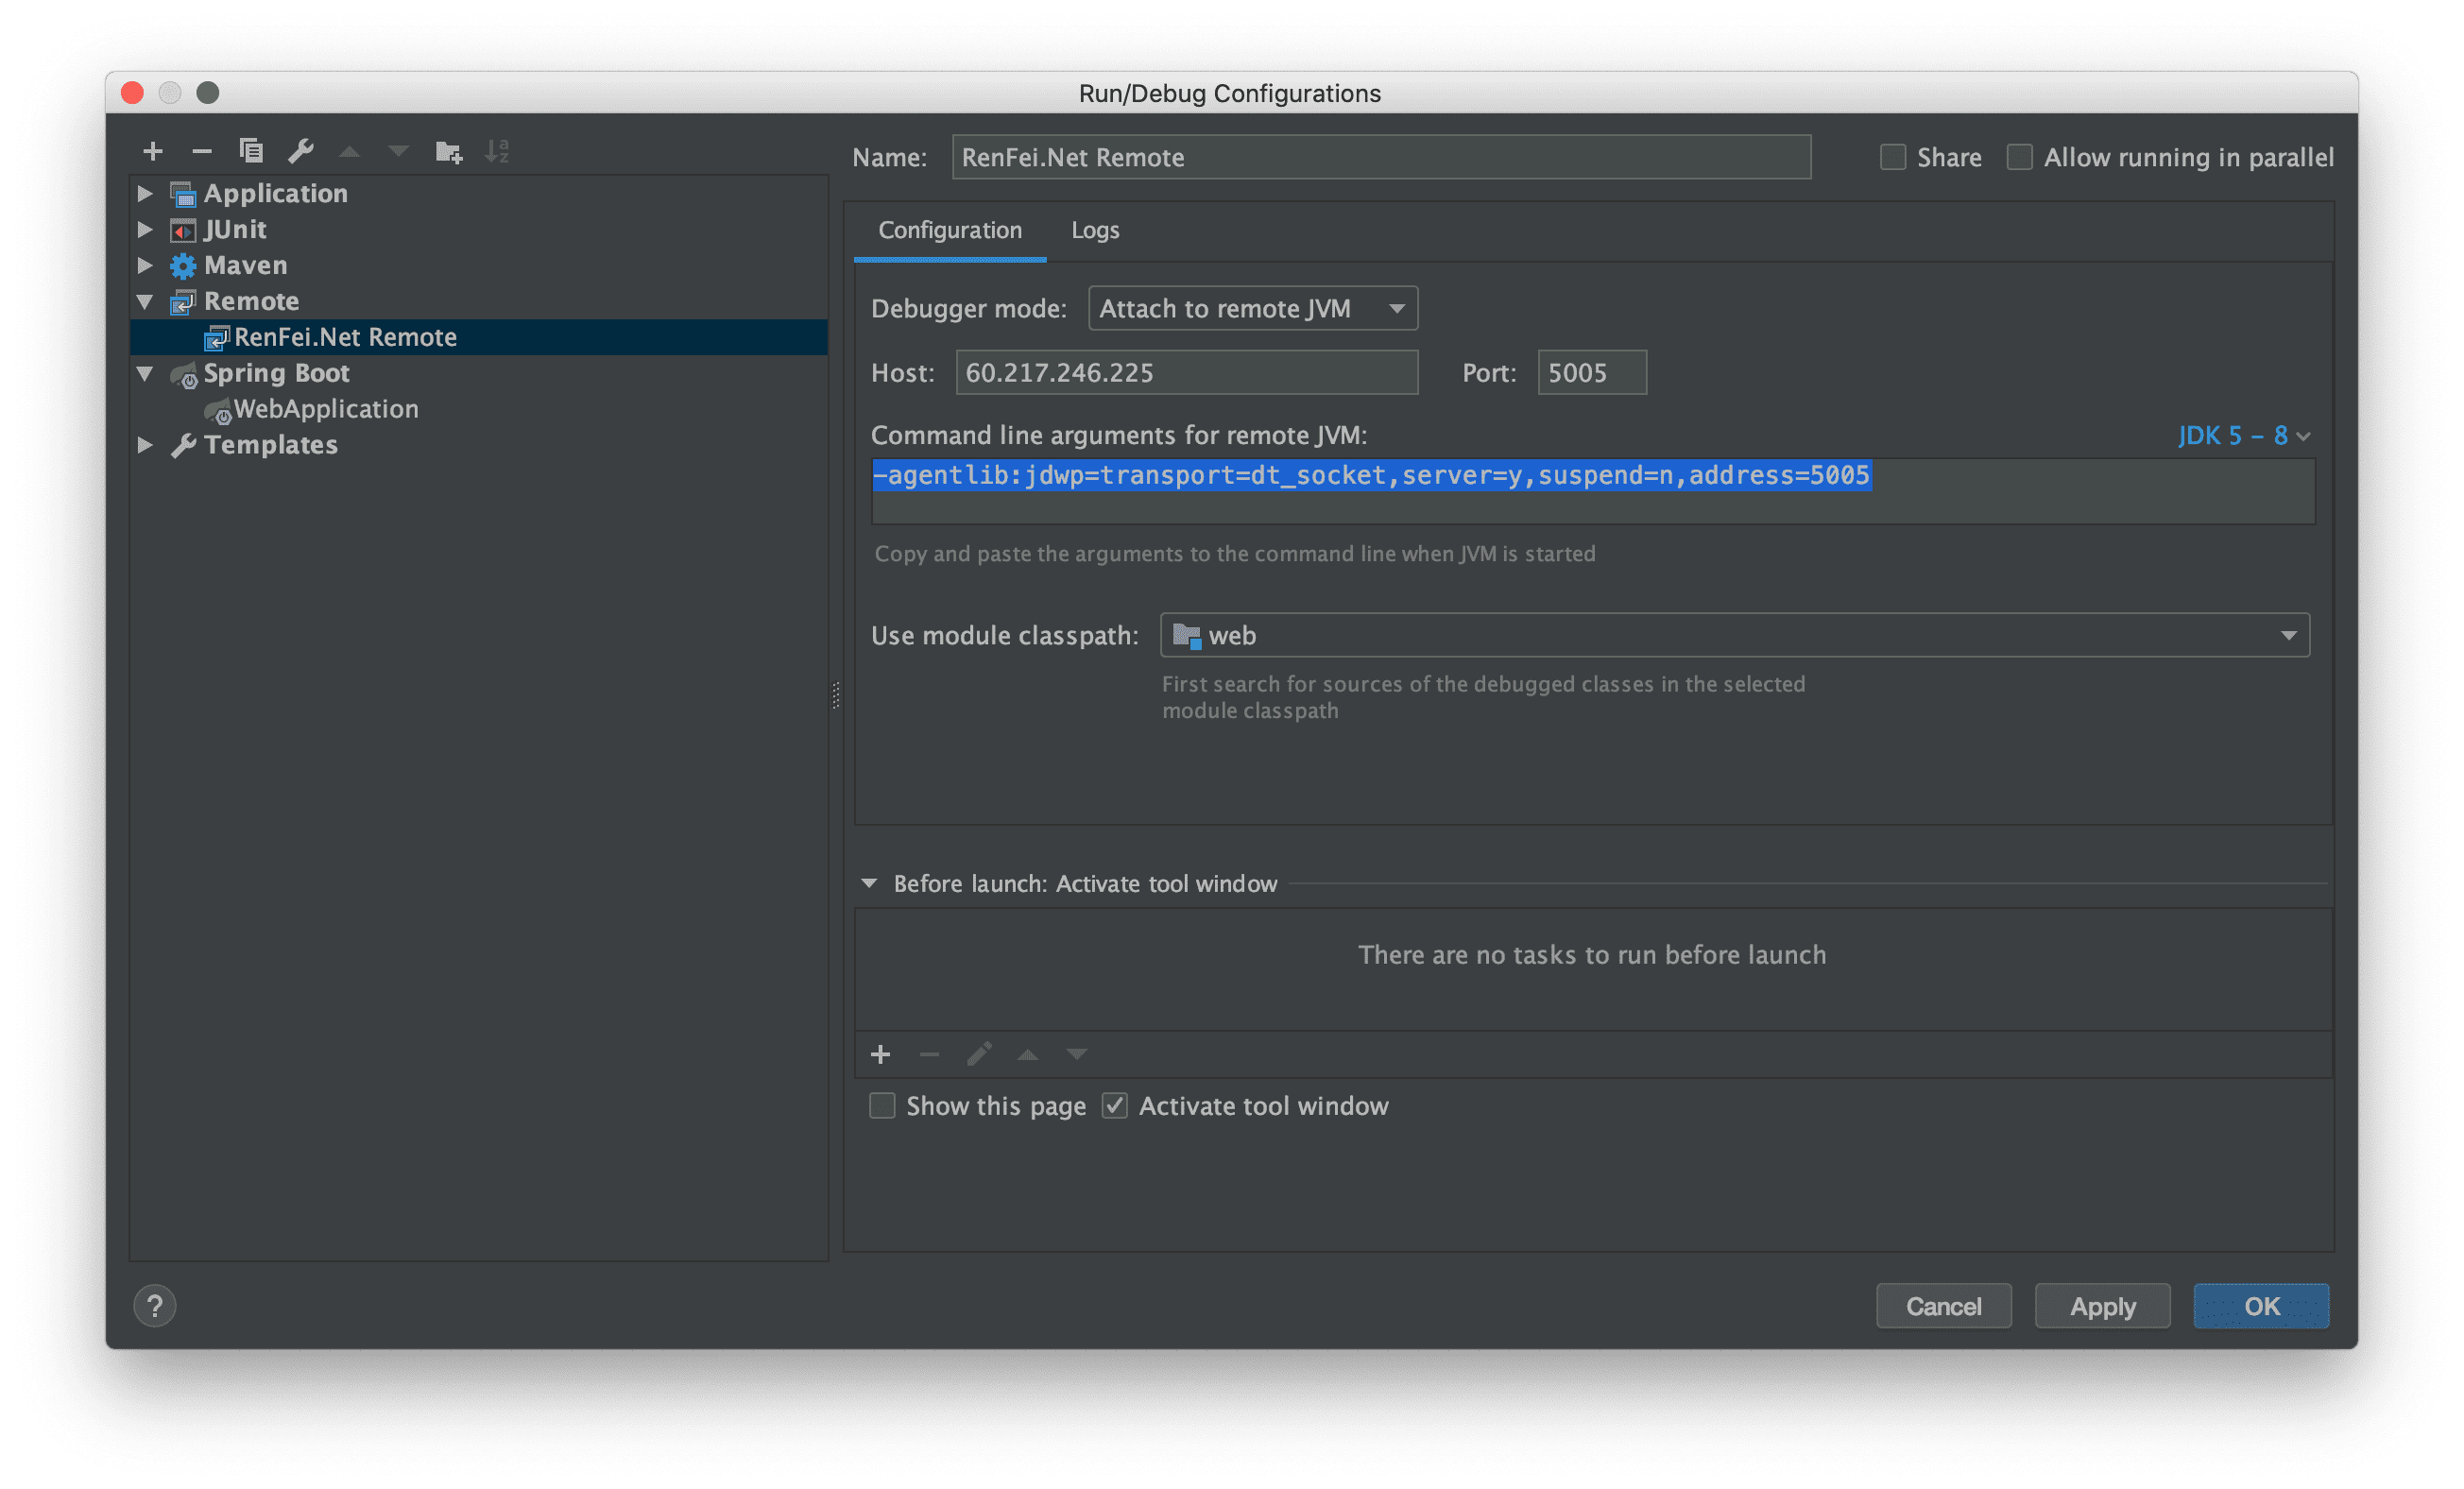
In “Command line arguments for remote JVM”, choose the JDK version on the right — this is based on the JDK running on your remote server. I selected JDK 5-8, which gives a command; mine is:
-agentlib:jdwp=transport=dt_socket,server=y,suspend=n,address=5005This command starts remote debugging. For the curious, here’s what it means:
-
jdwp is short for Java Debug Wire Protocol
-
transport: two forms — socket and shared memory. For cross-machine, only socket can be used;
-
server: whether the JVM should act as the debug server
-
suspend: whether to start the VM after the debug client connects. If y, the program starts only after the debugger on the debug machine is opened; otherwise the program starts without pausing and runs directly.
-
address: listens on port 5005 as the debug port
Server-side Debug Environment
Program Started as a Jar
For a program started as a Jar, such as Spring Boot, you can add this command at startup, for example:
java -jar -agentlib:jdwp=transport=dt_socket,server=y,suspend=n,address=5005 web.jarTomcat (war) Project
For a project running under Tomcat (war), you need to modify the Tomcat startup script — catalina.sh on Linux, catalina.bat on Windows — and add this command:
JAVA_OPTS="$JAVA_OPTS -agentlib:jdwp=transport=dt_socket,server=y,suspend=n,address=5005"After adding the JVM parameters on the server side, once the program starts you can run the DEBUG on your computer. If the connection fails, check whether the network firewall allows the port.
Exploring the Principle
The core is the JPDA (Java Platform Debugger Architecture) framework. IBM has a very detailed introduction:
Key excerpts:
-
JPDA is the JVM debugging standard; any JDK must implement it.
-
Debugging a Java program is essentially requesting the JVM’s current state. This requires sending certain commands to the JVM and setting certain callbacks.
-
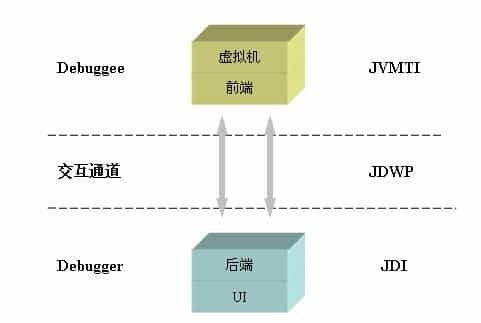
JPDA has three layers: Java Virtual Machine Tool Interface (JVMTI), Java Debug Wire Protocol (JDWP), and Java Debug Interface (JDI). Their roles:
-
JVMTI (Java Virtual Machine Tool Interface): the native interface to the JVM, at the bottom of the stack. All debugging functions rely on this interface. It is the interface for debuggers and profilers and the basis for thread analysis, monitoring, and code coverage checks. A tightly coupled Agent implements JVMTI. The Agent loads early during JVM initialization or at runtime (corresponding to the suspend parameter above).
-
JDWP (Java Debug Wire Protocol): the interactive communication protocol. It defines the commands, response data, and error codes in the interaction. It does not include the transport-layer implementation. It is mainly divided into a handshake phase and a response phase.
-
JDI (Java Debug Interface): parses JDWP and provides queues, caching, and other services for it. It is divided into a data module that maps all data and state on the VM to Java data objects; a link module where the debugger initiates a connection to the VM to obtain various states, in active or passive form; and an event request and handling module.
-
Because of the godlike existence of the JVM, Java’s execution is inherently controllable, so developing its debugger is far easier than C++.
-
Similar tools: Apache Harmony