This is part of an ongoing series. Based on Renfei’s Blog 2020 Major Update, I’m covering each area separately: region selection, cloud server configuration, environment setup (JVM), caching strategy, Spring Boot configuration, and front-end page optimization.
Note: this is my personal experience, not a professional benchmark. Some of it isn’t rigorous — please bear with me.
The last post finished the Spring Boot back-end optimization and technology choices. This one covers front-end page performance optimization.
The Standard I Optimized Against
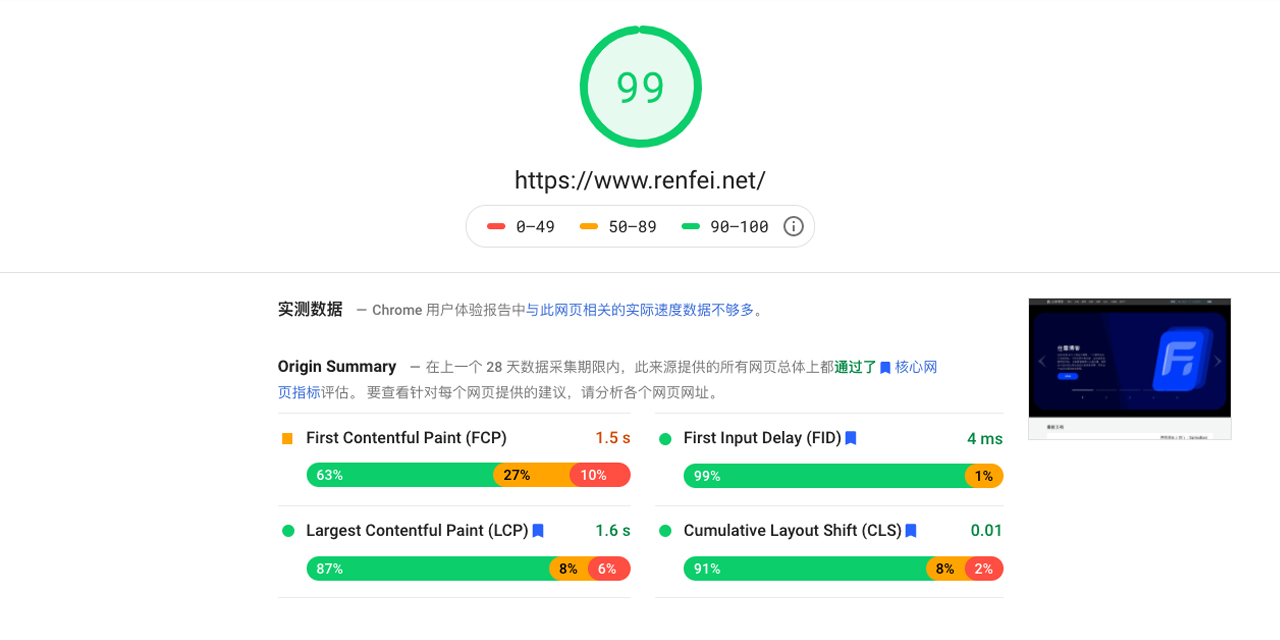
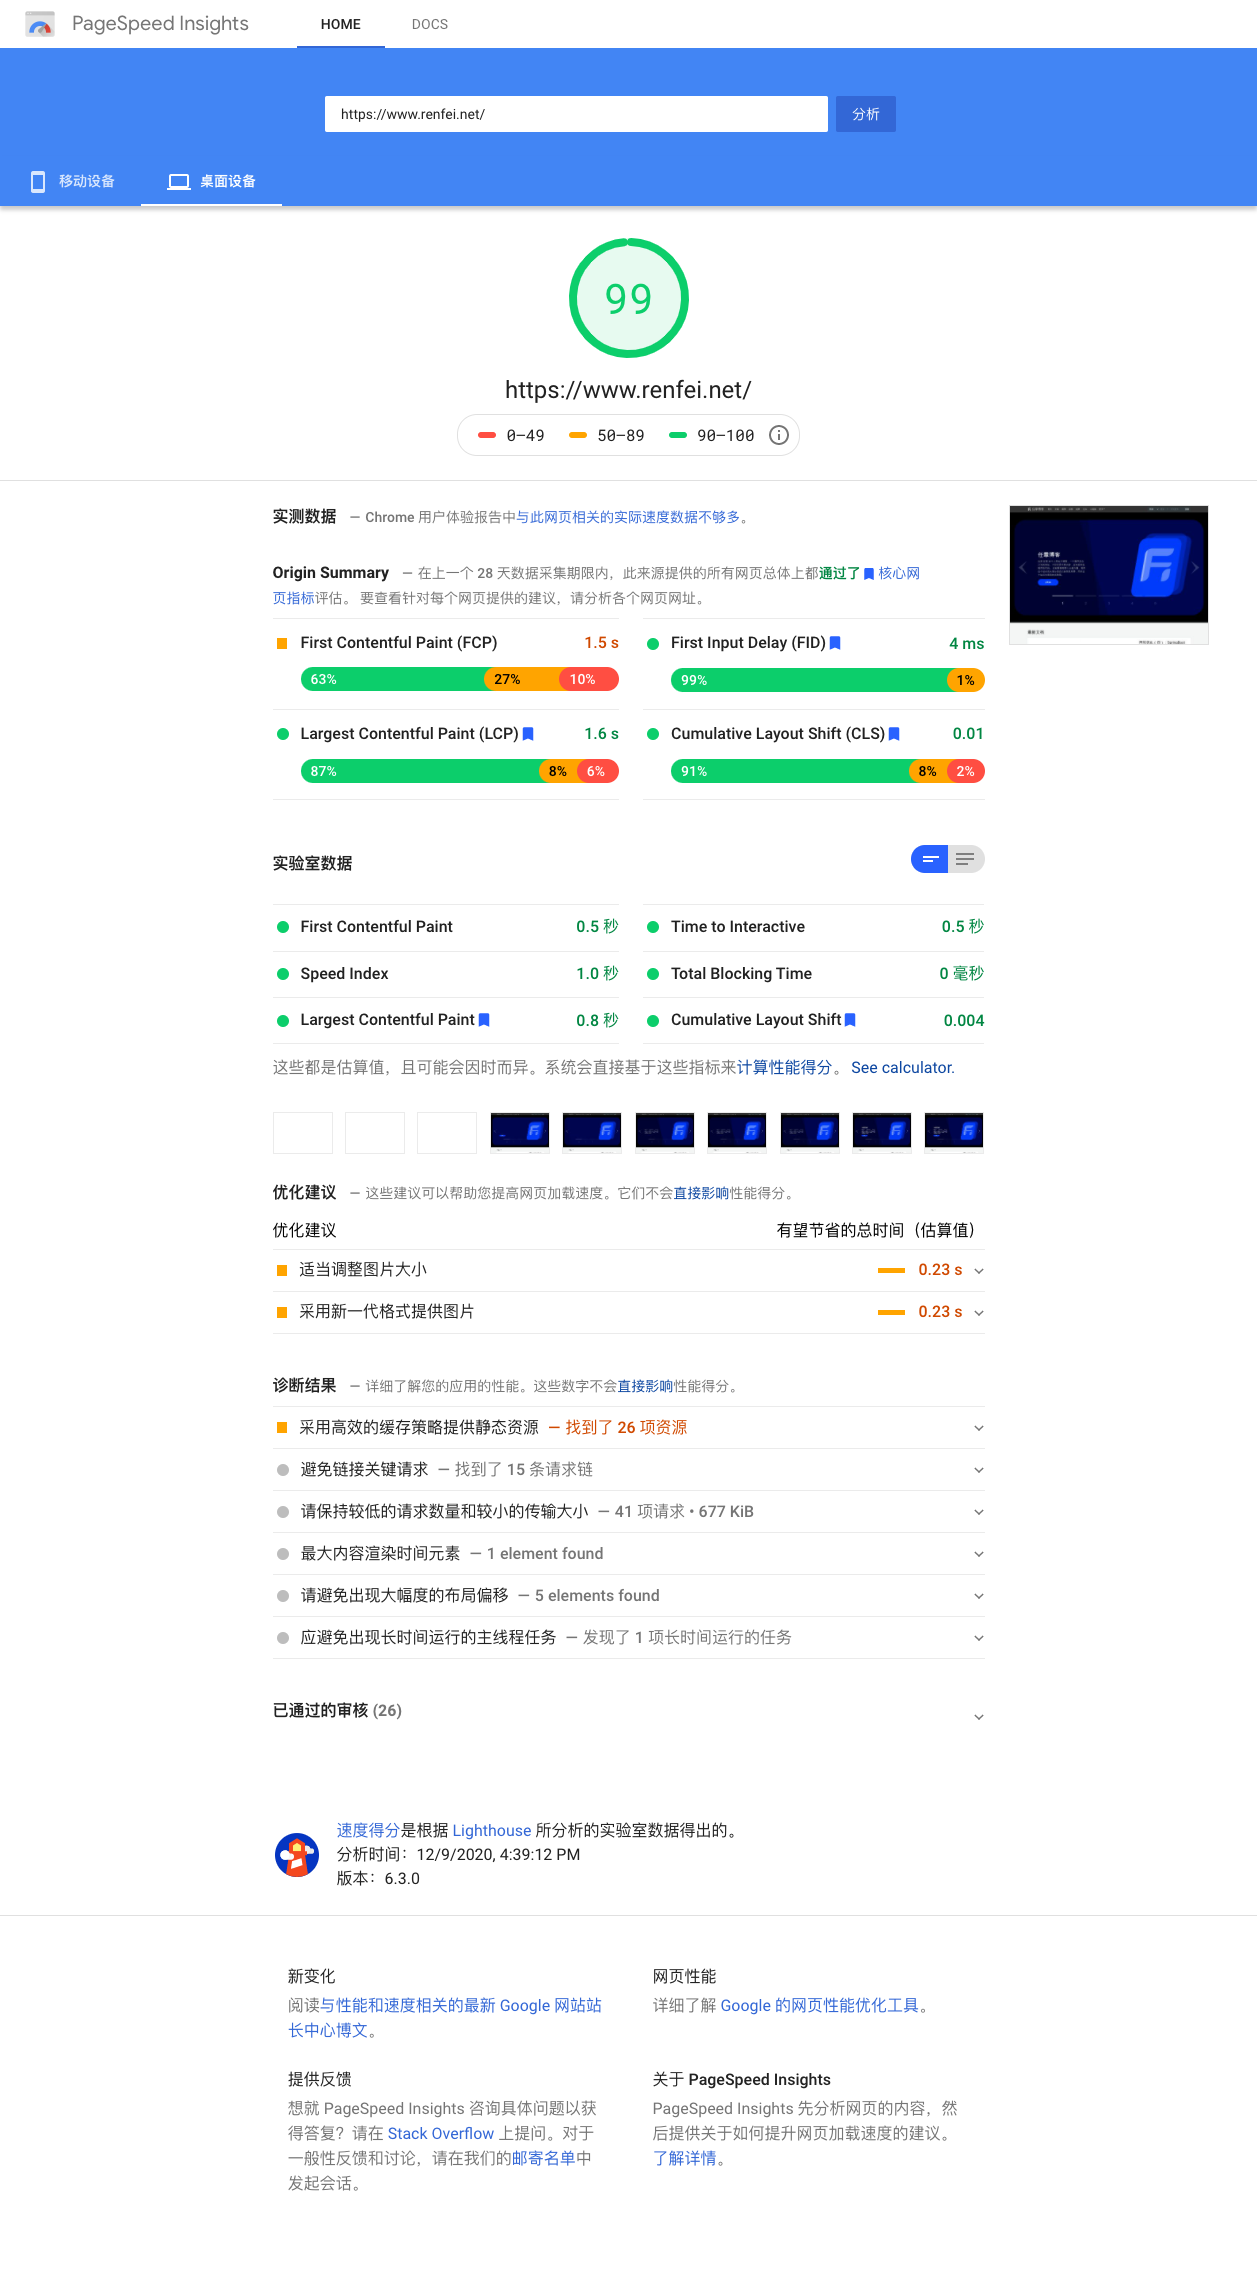
If you’re going to optimize, you need a guiding document or standard. I optimized against Google’s criteria. Google has a guidance site at https://web.dev and a measurement tool at https://developers.google.com/speed/pagespeed/insights. Here’s how my results look:
Six Evaluation Dimensions
Google evaluates pages roughly along six lines: First Contentful Paint (FCP), Speed Index, Largest Contentful Paint (LCP), Time to Interactive (TTI), Total Blocking Time (TBT), and Cumulative Layout Shift (CLS).
First Contentful Paint (FCP)
FCP is how long it takes the browser to render the first bit of DOM content after a user visits your page. Images, non-white <canvas> elements, and SVGs on the page count as DOM content. This is a fairly composite metric — optimizing it really means making the page load faster. You can use a CDN to speed up response times, and if you use webfonts, you can make them visible during loading so users see content right away.
Time to Interactive (TTI)
Pages request other documents dynamically, and that produces interactivity. This metric measures how long it takes for the page to become fully interactive. To optimize it, request fewer resources: strip out unneeded CSS, JS, and images to shorten interaction time. Enable gzip compression, use compressed images, and minify code down to whitespace-free form.
Total Blocking Time (TBT)
TBT measures the total time during which the page is blocked from responding to user input — mouse clicks, screen taps, key presses. In practice this is when the page has to stop and execute JavaScript: the browser is blocked and can’t respond to user input. Any JS execution over 50 milliseconds counts as slow. To optimize: remove unnecessary JavaScript, use developer tools to find poorly performing JavaScript and fix it. I’ll cover how to use developer tools below.
Largest Contentful Paint (LCP)
LCP measures when the largest content element in the viewport gets painted to the screen. Failing this is usually caused by big images. Try compressing and reducing image dimensions and file size — I cropped my images down to just what the page displays, cutting unnecessary waste.
Cumulative Layout Shift (CLS)
CLS measures whether and how much elements shift around while the page loads. The trick here is telling the browser an element’s size in advance, so the browser reserves the space before rendering and other elements don’t get displaced. For example, add width and height to your img tags so the browser knows how big the element will be.
Speed Index
Speed Index measures how quickly content becomes visually displayed during page load. Put plainly: how long the page takes to finish rendering and show something. To optimize it, cut unnecessary CSS files, move JavaScript to the bottom of the page, reduce main-thread work, and reduce JavaScript execution time.
Developer Tools
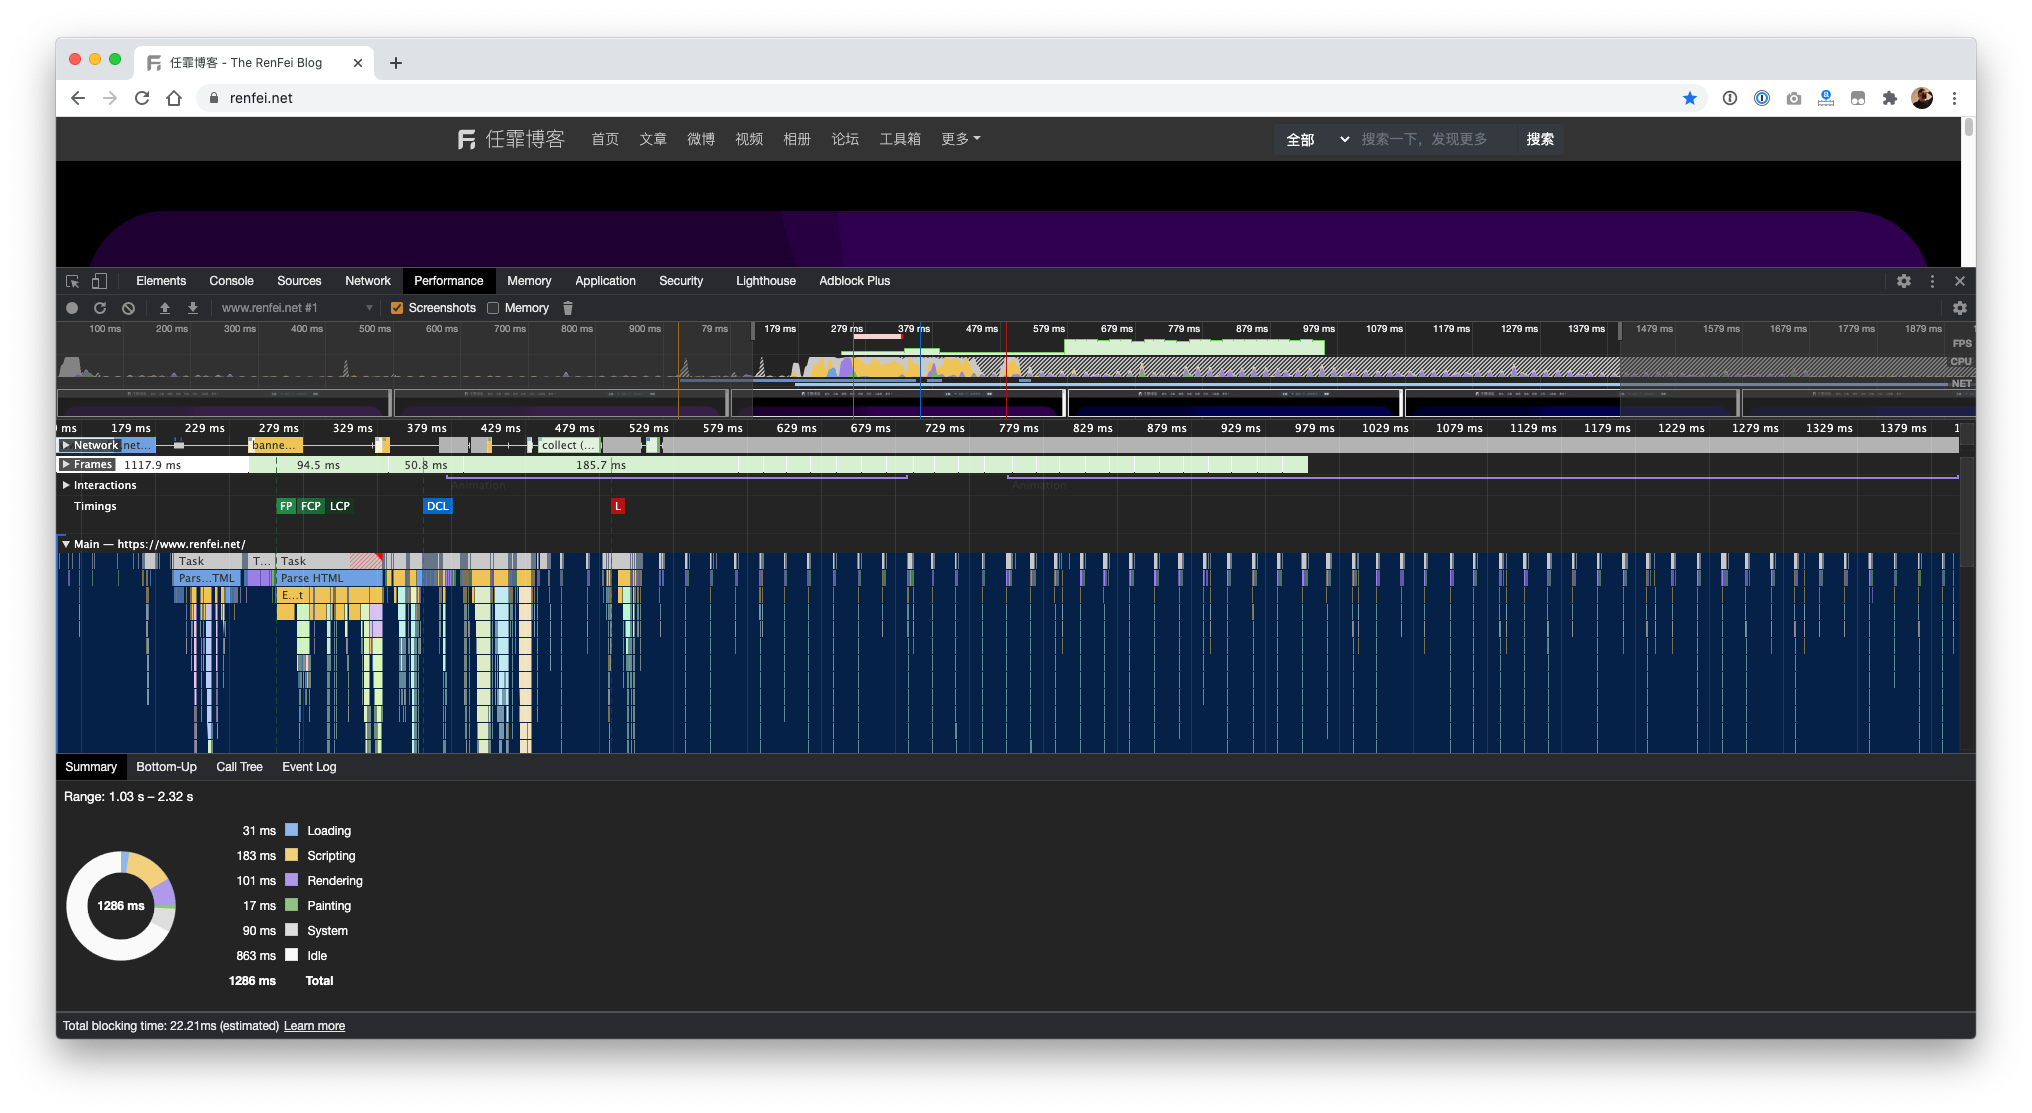
I mentioned using developer tools to debug pages above. Front-end engineers will know these well. I use Chrome: open them from Menu → More tools → Developer tools. In the Performance tab you can record the current page’s performance information — network requests, what the main thread is doing, which resources were requested, when the GPU was used, what was painted at each moment. In this tool you can easily find what’s blocking your page, then start debugging and optimizing its performance.